
Accelerated Reliability Test Results
Importance of Input Vibration Spectrum and Mechanical Response of Test Article
Repetitive Shock (RS) and Electrodynamic (ED) vibration systems produce substantially different vibration conditions at the input point to the test article. These differences are most evident in terms of peak G level and spectrum content.
The "RS" System produces vibration in short bursts which contain extremely high G amplitudes at the leading edge of each air hammer impact. The frequency content of the "RS" spectrum is non-uniform and exhibits many "holes" in the test spectrum.
The "ED" System produces a continuous vibration time history that contains peak G amplitudes that vary within a moderate, programmable range. The distribution of vibration energy over the test spectrum is uniform and easily programmed using accelerometer feedback (closed-loop) control.
The successful implementation of Accelerated Reliability Stress Testing requires a thorough understanding of a product's failure modes as well as the proper selection of the screening test system and its capabilities (ref 2). Without prior knowledge of product responses and the actual dynamic inputs produced by the test system, effective stress test results may be unachievable.
It has been shown that screening test results may be significantly different when the same product is tested on vibration systems with different operating characteristics and performance limitations (ref 1,3). It follows, therefore, that the product's failure modes and the test system's operating characteristics must be understood before selecting the proper stress function, stress magnitude and type of test equipment (ref 2).
Case Study
Two types of vibration screening systems are presently installed in the HALT/HASS lab at a prominent disk drive manufacturer in the San Francisco bay area. One test system is a Repetitive Shock machine, which produces vibration using an array of pneumatically powered impactors, or air hammers. In this discussion, the Repetitive Shock system will be referred to as the "RS" System.
The second vibration screening system in the HALT/HASS lab is an Electrodynamic table, which generates vibration using an electrodynamic (voice coil) shaker powered by an electronic amplifier with closed-loop spectrum control. In this discussion, the Electrodynamic system will be referred to as the "ED" System.
A variety of 3.5 inch disk drive products were tested to establish the response characteristics of these drives using input vibration from the "RS" System and from the "ED" System. The results produced by these two Systems were remarkably different. For example, drives screened on the "RS" System failed almost immediately (within seconds) from initial vibration turn-on, even with the "RS" System controller set for a vibration level of 1.0 G rms. By comparison, drives screened with the "ED" System did not fail abruptly upon turn-on for the same 1 G rms control level. As a rule, failures during "ED" System operation increased generally in proportion to increasing G rms test levels.
Why were the "RS" and "ED" drive failures so dramatically different at presumably low vibration inputs from both machines? To clear the air, a comparative technical evaluation of the "RS" and "ED" systems was undertaken.
The following material describes some technical characteristics of the "RS" and "ED" Systems and offers commentary on the pros & cons of each System with respect to the testing of disk drive assemblies. The application results noted herein may vary for other products as a function of product size, mass and dynamic responses associated with specific failure modes.
The test parameters of primary technical interest for this study were the actual vibration spectrum generated by each System and the maximum vibration amplitude (g pk) contained within the spectrum produced by each System.
The Repetitive Shock "RS" System
The "RS" vibration table consists of a 36" x 36" metal plate with a G-10 thermal barrier bolted to the upper surface of the plate. Pneumatic impactors (air hammers) are attached to the bottom of the metal plate, to deliver repetitive shock impacts to test articles secured by fixturing to the top surface of the 36" square table. The shock impacts become more severe as the G level setpoint is increased at the "RS" control panel.
In order to characterize the actual vibration conditions produced by the "RS" system, a calibrated accelerometer was mounted on the table surface, at the center position. The "RS" system controller was programmed for a test level of 1 G.
The accelerometer output signal was connected to an Unholtz-Dickie Vwin II signal analyzer to measure the vibration in terms of the following:
- Vibration Time History - G vs. Time (amplitude)
- Vibration Spectrum - G vs. Hz (frequency content)
Figures 1 and 2 show the Vibration Time History and the Vibration Spectrum of a typical accelerometer measurement taken at the center of the "RS" table while operating at a setpoint of 1 G (according to the "RS" System control panel).
Figure 1: Vibration Time History "RS" machine
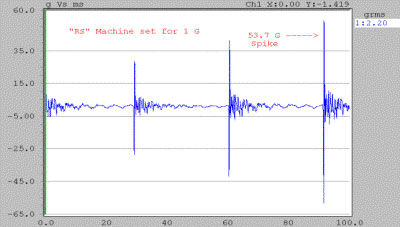 The vibration occurs as a series of bursts with extended periods of essentially zero G amplitude between the bursts. The peak G value of each burst corresponds to the impact of an air hammer on the bottom surface of the "RS" table.
The instantaneous G level produced by a hammer impact can be many times higher than the setpoint level on the "RS" system control panel. In this example, a setpoint of 1 G on the control panel actually resulted in burst amplitudes exceeding 50 G.
The large numerical difference between the actual peak G as seen on the vibration time history in Figure 1 and the 1 G setpoint of the "RS" control panel suggests that the vibration level measurement made by the "RS" controller is heavily "time-averaged". Because the vibration amplitude is practically zero during most of the measurement frame, the extremely high peak "g" spikes, which occur only at hammer impacts, are time-averaged with long periods of nearly zero G levels. This results in a "displayed" G level on the "RS" system that significantly discounts the extreme peak accelerations that occur upon impact at each air hammer site.
For stress testing of disk drives, this data raises serious concerns about the damage potential for these high G spikes, which are an inherent characteristic of the "RS" vibration output, as shown in Figure 1.
Figure 2: Vibration Spectrum "RS" machine
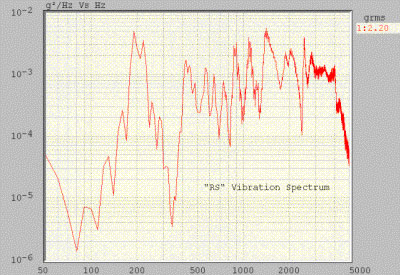 Figure 2 is a spectrum analysis of the vibration measured at the center of the "RS" table. Over the frequency range there are significant "gaps" in the spectrum, or frequency bands where very little vibration energy exists.
Keeping in mind that the vertical axis of Fig 2 is a log scale, it is clear that variations in vibration spectrum strength of more than 100:1 are common throughout the "RS" test spectrum. In some cases (80 Hz vs. 1500 Hz) spectrum gaps exceed a 1000 : 1 ratio.
This Figure 2 snapshot of an "RS" system vibration spectrum indicates that the vibration energy distribution is very non-uniform over the frequency range. This non-uniformity factor raises a question about screening effectiveness for precipitating mechanical failures. Since there is no way to eliminate these spectrum "gaps" in the "RS" system, it is reasonable to question whether a disk drive can be screened effectively if important mechanical response frequencies inherent to the drive that happen to coincide with these "RS" spectrum "gaps".
The Electrodynamic "ED" System
The "ED" System vibration table consists of an electrodynamic shaker equipped with a magnesium head expander, which provides a 20" x 20" test article mounting surface. Vibration is generated by an internal driver coil (armature), which is powered by an electronic amplifier. The "ED" System is operated by means of a PC-based Controller using accelerometer feedback to maintain closed-loop control of overall test level (G rms) as well as control of the vibration frequency content (spectrum shape).
A calibrated accelerometer was attached to the center of the "ED" table. The PC Controller was programmed for 1 G rms and a uniform vibration spectrum from 20 - 2000 Hz. The accelerometer signal from the "ED" system was analyzed in terms of its vibration time history and frequency content for direct comparison with the vibration programmed on the "RS" system. Refer to Figures 3 and 4.
Figure 3: Vibration Time History "ED" machine
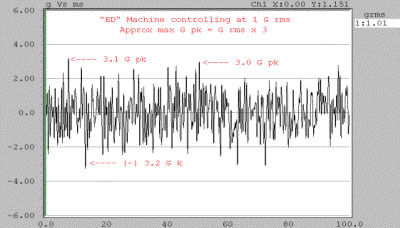 Notice in Figure 3 that the vibration signal over time is continuous (no "bursts" or prolonged zero G periods).
The vibration amplitude varies with time, but even the highest peaks stay within a range of approximately +/- 3 times the overall G rms level (so called "3-sigma" peaks). This "sigma" limiting factor is an operator selectable value on the "ED" controller, making it possible to keep the max peak G levels of the "ED" vibration within predictable limits.
By selecting a "sigma limit" value of 3, for example, the operator can limit the max peak vibration levels to approximately ( G rms x 3 ). Notice in the vibration spectrum per Figure 4 (next page) that the overall vibration level is 3 G rms which corresponds to a maximum pk acceleration of 9 G pk.
Figure 4: Vibration Spectrum "ED" machine
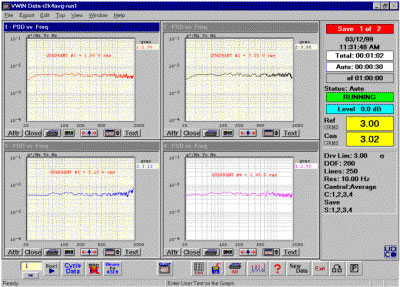 Figure 4 is a spectrum analysis of the vibration measured at 4 different locations on the "ED" table. Each spectrum display represents a different quadrant of the 20" x 20" table. Notice that these spectrum distributions are uniform and free of spectrum "gaps."
The "ED" controller uses electronic feedback to maintain the desired G rms vibration level and the desired spectrum shape at the 4 control accelerometer locations. In this case, a uniform ("flat") vibration spectrum has been programmed on the "ED" Controller.
Note that the random vibration data in Figure 4 has been taken at a test level of 3 G rms, which is different than the test level for the time history data in Figure 3, taken at a level of 1 G rms. Therefore the maximum pk acceleration produced by the spectrum in Figure 4 is approximately 9 G pk (3 G rms x 3).
Comparative Comments
| Comparison Area | "RS" System | "ED" System |
|---|---|---|
| Vibration Waveform | Non-programmable: Repetitive G spikes only | Programmable: Sine, Random, or Shock |
| Low Limit | 150 Hz (*) | 5 Hz |
| High Limit | 10,000 Hz + (*) spectrum energy is greatly attenuated below first bending mode of 36" sq table: Fn = 200 Hz |
3,000 Hz |
| Vibration Spectrum Uniformity | Non-uniform: many frequency "holes" | Highly uniform: no frequency "holes" |
| Vibration Energy Distribution vs. Freq. | Fixed distribution: majority of energy in high freq range < 1KHz (not adjustable) | Fully programmable over operating range of system |
| Max peak "g" level during test | Extreme "g" spike with each hammer impact 50 g pk + typical | Max g pk = g rms X 3 (programmable) |
| Is frequency spectrum "notching" possible? | No | Yes |
| Can Vibration Table Be Linked With HALT/HASS Temperature Chamber? | Yes | Yes |
| Vibration Table Size | 36" x 36" typical (other sizes optional) |
24" x 24" typical (other sizes optional) |
| Utility Requirements | Compressed air | 3 phase electrical |